Journey Mapping
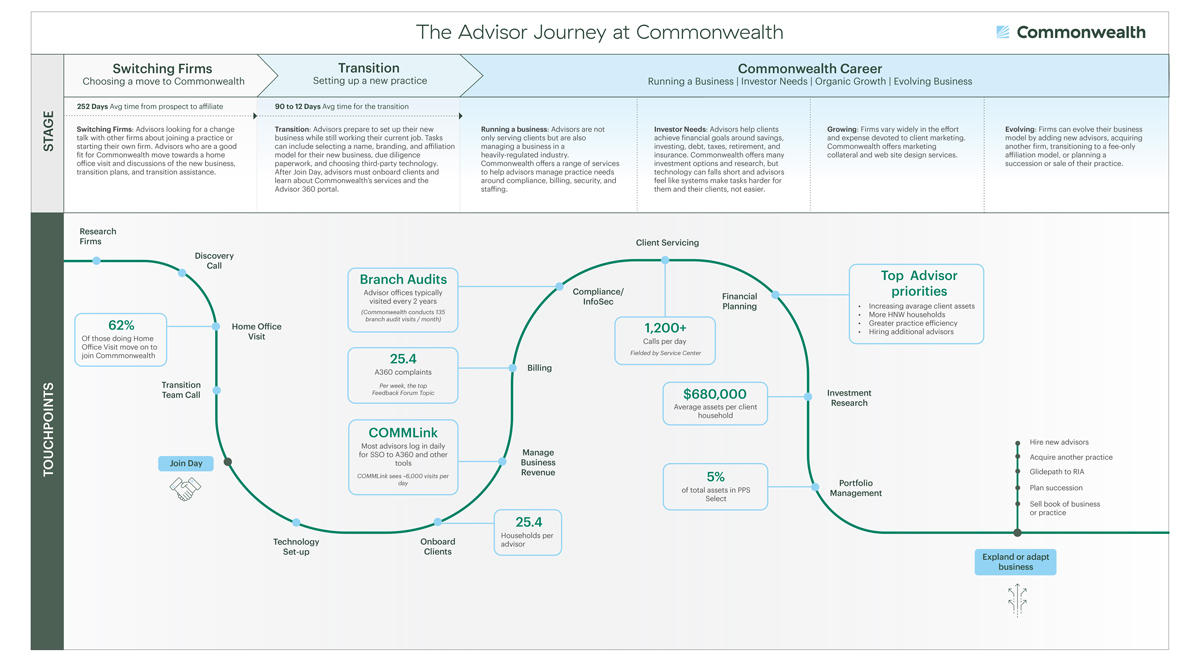
The Journey Mapping shown below is an example of an infographic created to illustrate the journey of an advisor at Commonwealth. It was designed in collaboration with stakeholders from Market Intelligence. The editable visual is in landscape format, used in PowerPoint presentations as a supportive visual to guide conversations on the user journey. The layout is divided into stages and touchpoints. The stage section introduces the three macro areas of the journey: switching firms, transition, and career. Each area provides details about the step, with approximate timing included when available.The second part is a visual representation of the journey that shows all the steps, with tooltips providing additional information and data about specific points. Two areas particularly highlighted in the infographic are the Join Day and the Expand or Adapt Business stages, which lead to multiple possible actions the user can take.